TL;DR
Bearish candlestick patterns are powerful tools that reveal the market's strength between buyers and sellers, often indicating a reversal. These candles can help predict future price movements and should be analyzed in their proper contexts.
Candlestick patterns are essential for crypto traders, as they offer insights into market sentiment and can signal whether a trend is likely to continue or reverse. One of the key types of candlestick patterns to recognize is bearish patterns. These patterns indicate potential downward price movement, helping traders identify selling opportunities.
In this article, we’ll explore the top 5 bearish candlestick patterns and the strategies that traders use to capitalize on them.
Table of Contents
- The Hanging Man
- The Shooting Star
- Bearish Harami
- Three Black Crows
- Dark Cloud Cover
1. The Hanging Man
The Hanging Man is a bearish pattern that forms near the peak of an upward trend. It’s characterized by a small body and a long lower shadow. Despite the upward momentum, the long lower wick signals that sellers are starting to take control.

- Key Signal: A Hanging Man at the top of an uptrend may suggest that the market is ready for a reversal. Traders look for a subsequent down day to confirm the trend shift.
- Trading Strategy: After spotting a Hanging Man pattern, consider shorting the asset after a confirming downward candle. Ensure the volume is above average for increased reliability.
2. The Shooting Star
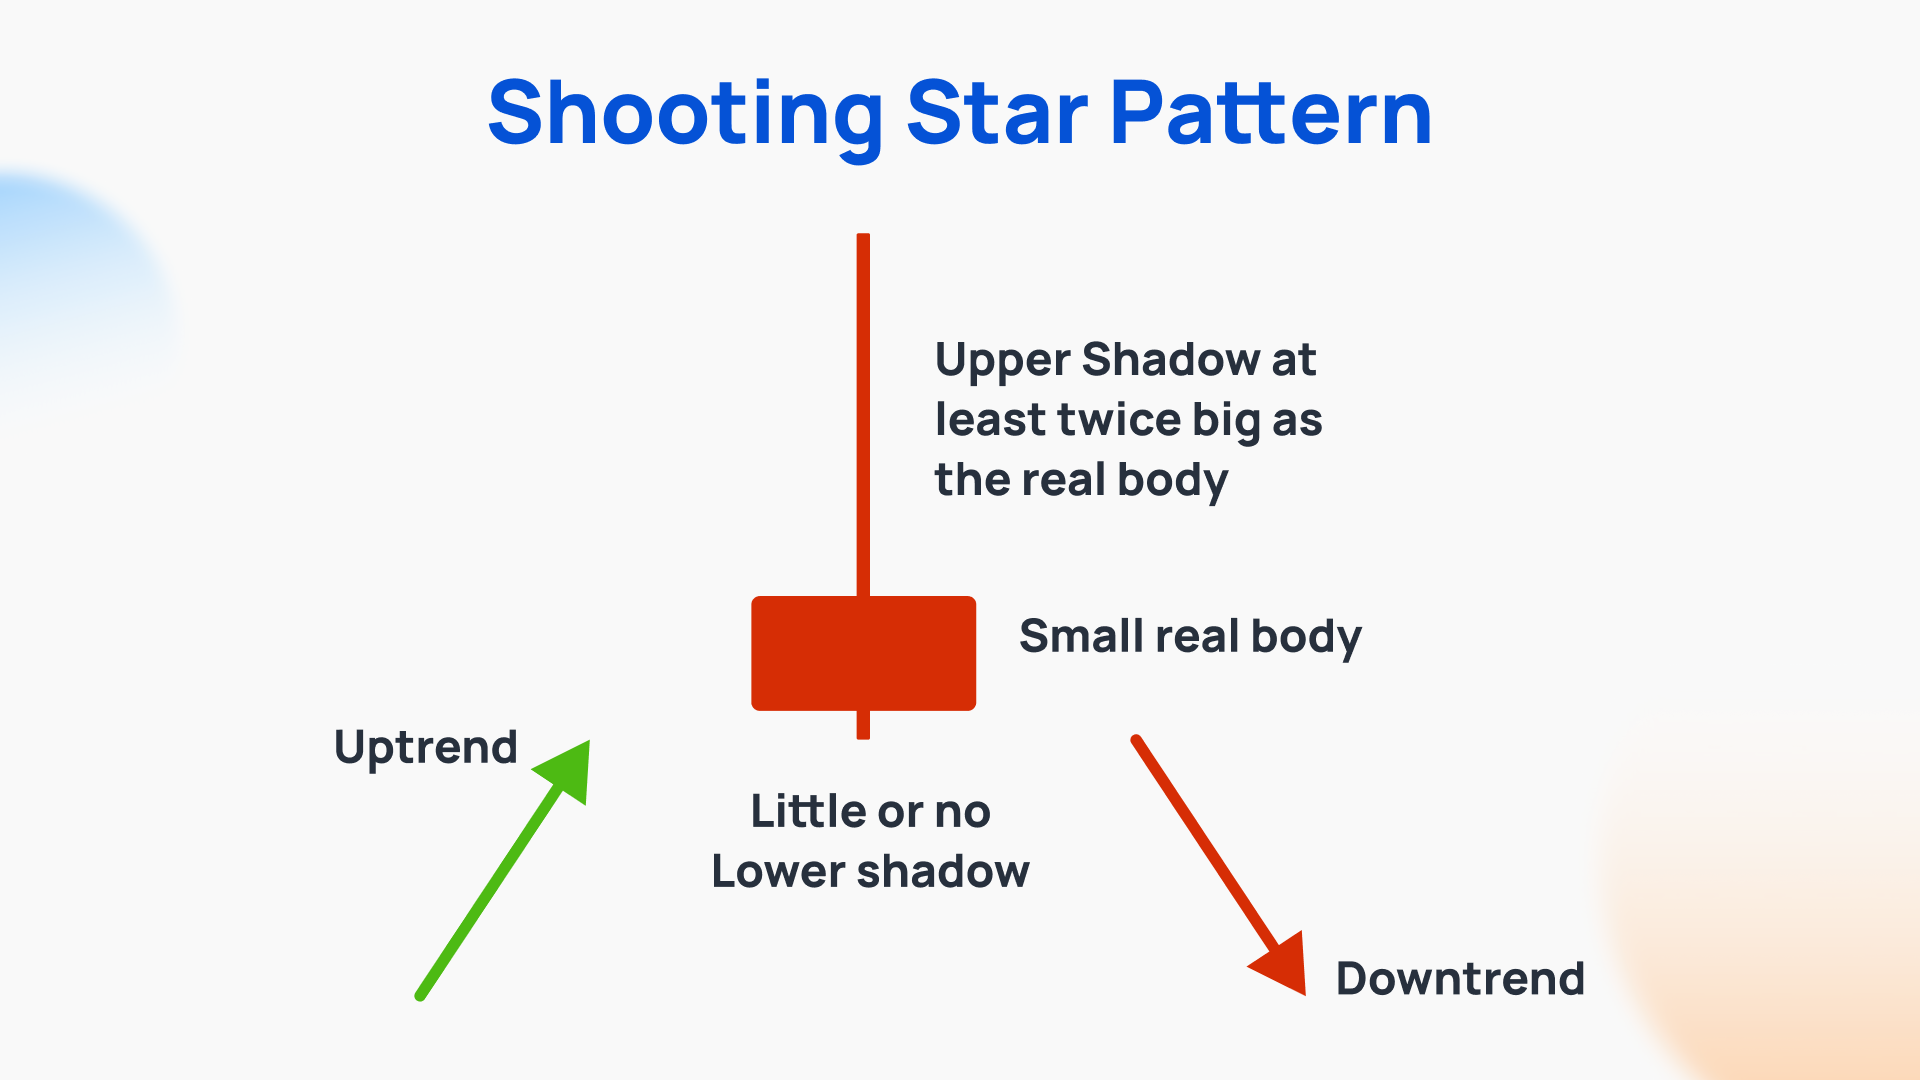
The Shooting Star is a strong bearish signal that appears after a price increase. It has a small body, a long upper shadow, and little to no lower shadow. The pattern suggests that buyers were initially in control, but sellers have taken over by the end of the period.

- Key Signal: A valid Shooting Star occurs at the top of an uptrend. The subsequent candle should close lower than the Shooting Star’s close to confirm the reversal.
- Trading Strategy: Once a Shooting Star appears, wait for the next candle to open lower or gap down before entering a short position.
3. Bearish Harami
A Bearish Harami occurs when a long green candle is followed by a smaller red candle. The body of the second candle is contained within the body of the first, indicating a potential trend reversal.

- Key Signal: A Bearish Harami near the end of an uptrend is a warning sign of a downtrend. The second candle's low is often a key level to watch.
- Trading Strategy: If the price breaks below the second candle's low, consider entering a short position. Using indicators like RSI or the stochastic oscillator can help improve the timing of this strategy.
4. Three Black Crows
The Three Black Crows pattern signals the end of an uptrend. It consists of three consecutive long red candles, each opening within the body of the previous one and closing lower.

- Key Signal: This pattern indicates that bears have taken control, and the trend is likely to continue downward.
- Trading Strategy: After spotting Three Black Crows, watch for increasing volume to confirm the strength of the trend. You can enter short positions with a stop-loss just above the last red candle’s high.

Technical indicators, such as the relative strength index (RSI), where a value below 30.0 indicates oversold circumstances, and the stochastic oscillator indicator, which reflects the velocity of movement, are the best ways to determine whether an asset is oversold.
5. Dark Cloud Cover
The Dark Cloud Cover pattern forms when a large red candle opens above the previous candle's close but closes below the midpoint of the green candle. It signals a shift from bullish to bearish sentiment.

- Key Signal: The Dark Cloud Cover signals a potential reversal, especially if it forms after a strong uptrend.
- Trading Strategy: Wait for a confirming bearish candle following the Dark Cloud Cover. If the price continues to fall, consider shorting the asset.
Using Candlesticks as Trading Indicators
Candlestick patterns, while useful, should not be analyzed in isolation. Traders often combine technical indicators and market fundamentals to validate their findings. For example, a candlestick pattern like a Bearish Harami may be more reliable when it aligns with an overbought condition indicated by an RSI reading.
Start Your Crypto Journey with Coins.ph
Coins.ph is a licensed cryptocurrency exchange regulated by the Bangko Sentral ng Pilipinas (BSP), providing a safe platform for buying, selling, and trading cryptocurrencies.
Sign up for a Coins.ph account now to start trading OR download the Coins.ph app. Once you have verified your account, you can convert PHP into the cryptocurrencies of your choice.
Get P50 in BTC when you sign up(with level 2 verification) and fund P200 into your coins wallets with promo code: coinsacademy
Join the Coinmunity
Connect with like-minded crypto enthusiasts! Be the first to learn about our news and campaigns.
- Twitter: https://twitter.com/coinsph
- Discord: https://discord.io/coinscommunity
- Telegram (Announcements): https://t.me/coinsph_announcements
- Telegram (Community): https://t.me/coinsphfilipino
- Instagram: https://www.instagram.com/coinsph/
- Facebook: https://www.facebook.com/coinsph/
- TikTok: https://www.tiktok.com/@coinsph_official
- YouTube: https://www.youtube.com/coinsph


